On September 9, 2026, the OECD released the PISA 2025 results, and Georgia had good news to celebrate. The country improved across all three core domains compared to 2022. The government highlighted that Georgia ranked first among 91 participating countries for improvement in science, achieved its best mathematics and science results in a decade, and was among the top three countries for reducing the share of low-performing students.
These are real achievements, and they deserve acknowledgment. But PISA results are easy to misread, and the headline numbers hide a more complex picture. As someone who has spent years working with international large-scale assessment data, I want to walk through what these scores actually mean – because understanding the measurement is the only way to understand the results.
First, How the PISA Scale Works
You cannot interpret a PISA score without knowing how the scale is built. PISA scores are not percentages, and they are not out of 100 or 1000. They sit on a scale that was originally constructed to have a mean of 500 and a standard deviation of 100 across the reference population of OECD countries.
That single fact is the key to reading everything else. A score of 500 is, by construction, the reference average. A standard deviation of 100 tells you how spread out performance is – roughly speaking, about two-thirds of students fall within 100 points of the mean, between 400 and 600. Moving 100 points on this scale is a very large difference. The OECD itself often describes a gap of roughly 20 points as equivalent to about a year of schooling, which means 100 points corresponds to something on the order of several years of learning.
Keep that scale in mind, because it reframes every number in the Georgian results.
What Georgia’s Numbers Actually Mean
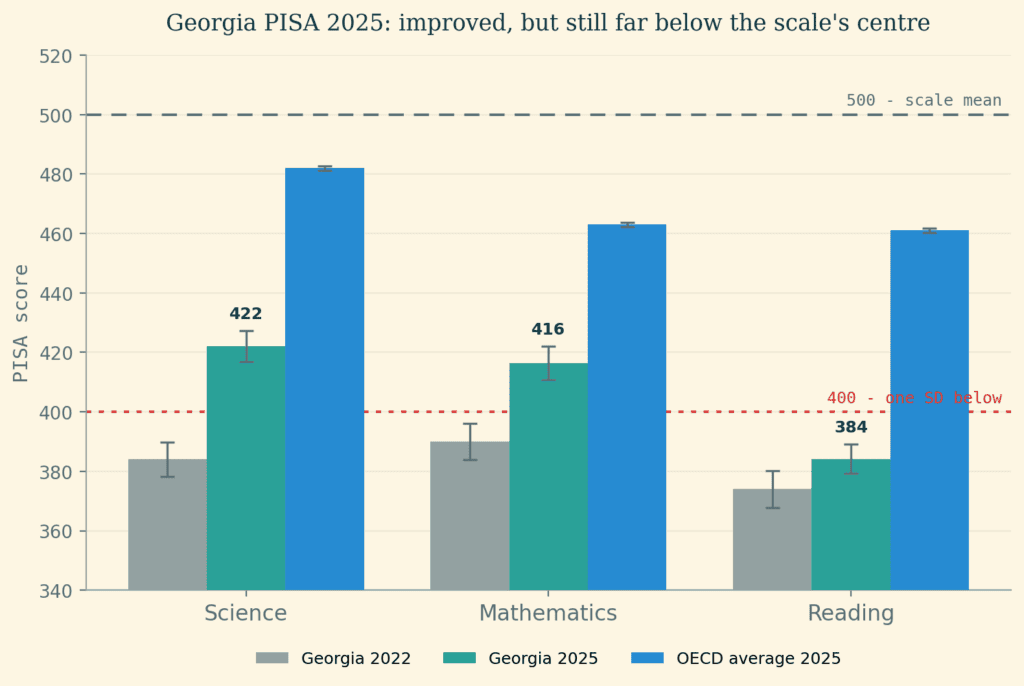
In PISA 2025, Georgia scored 422 in science, 416 in mathematics, and 384 in reading. Compared to 2022, that is a gain of 38 points in science, 26 in mathematics, and 10 in reading. The science and mathematics scores are the highest Georgia has ever recorded.
So here is the good news, stated plainly: Georgia improved, and reached its best-ever levels in two of the three domains. That is genuinely positive, and it should not be dismissed.
But now apply the scale. The OECD averages in 2025 were 482 in science, 463 in mathematics, and 461 in reading. Georgia’s science score of 422 sits about 60 points below the OECD average – and remember, the scale’s reference mean is 500. Georgia is sitting close to a full standard deviation below where the scale is centered. In reading, at 384, Georgia is well over one standard deviation below the reference mean.
This is the context the celebration tends to leave out. The improvement is real, but it is improvement from a very low base, and Georgia remains roughly a standard deviation beneath the scale’s midpoint. Both things are true at once: we went up, and we still have very far to go.
Understanding PISA Proficiency Levels
PISA doesn’t only produce a score – it sorts students into proficiency levels, and this is essential for understanding what the scores mean in practice.
PISA items are deliberately written to span a wide range of difficulty, so the test can measure students across the whole ability spectrum, from those who struggle with the basics to those capable of sophisticated reasoning. Based on their performance, students are placed into proficiency levels, numbered from the lowest up to Level 5 and 6 at the top.
The critical threshold is Level 2, which PISA defines as the baseline level of proficiency. Reaching Level 2 means a student can demonstrate the basic competencies needed to participate fully in society – in science, for example, using scientific knowledge in recognizable ways rather than merely recalling facts. Students below Level 2 are considered low performers who lack even this baseline. At the other end, Levels 5 and 6 represent top performers who can handle complex, demanding tasks.
These levels matter because two countries with different score distributions can tell very different stories. And Georgia’s proficiency numbers reveal exactly where its challenge lies.
Raising the Floor vs Raising the Ceiling
Here is the most important thing to understand about how Georgia improved. The gains came largely from reducing the number of students performing very badly – fewer students below the baseline. Georgia was among the top three countries for cutting its share of low performers. That is a real and worthwhile achievement.
But reducing low performers and producing high performers are two very different things, and they reshape the distribution in different ways.
Think of the distribution of student scores as a curve. Reducing the number of very-low performers pulls up the left tail – it raises the floor. Fewer students are stuck at the bottom, and because those students are now scoring higher, the average rises. This is good: it means fewer children are being left without even basic skills.
But raising the floor is not the same as raising the ceiling. Producing top performers means thickening the right tail – having more students who reach Levels 5 and 6. And here Georgia’s picture is stark: only about 1% of Georgian students reached the top proficiency levels, compared to an OECD average of 7%. In science, 55% of Georgian students reached at least the baseline Level 2, against 74% across the OECD. In reading, only 39% reached Level 2, compared to 69% across the OECD.
So Georgia’s improvement is real, but it is concentrated at the bottom of the distribution. We are lifting more students to a basic level, which is important. But we are still producing very few students who reach excellence. These are different educational achievements, they require different interventions, and a rising average can hide which one is actually happening. In Georgia’s case, the average rose mostly because the floor came up.
The Reading Problem
Among the three domains, reading is the one that should worry us most – and it is precisely where Georgia is weakest.
Reading rose only 10 points from 2022, to 384. More troubling, that figure is actually 17 points below Georgia’s 2015 reading score of 401. Reading is the one core domain where Georgian students perform worse than they did a decade ago. And only 39% of students reached even baseline proficiency.
Why does this matter more than the other domains? Because reading is the foundation of comprehension, and comprehension underlies everything else. If a student cannot fully understand what they read, they cannot fully understand what a question is asking of them. This affects performance far beyond reading tests: even in mathematics, a student with weak reading comprehension may misunderstand the problem itself, and get it wrong not because they lack mathematical skill but because they didn’t grasp what was being asked. Reading is not one subject among three – it is the substrate the other two are built on.
A country can make gains in science and mathematics scores while its reading foundation stays weak, but that foundation will eventually limit how far the other domains can go. This needs to be handled, and it deserves far more attention than it is getting amid the celebration.
About That 2022 Baseline
Whenever improvement is measured against 2022, a caveat is needed – though it cuts in more than one direction.
The commentary around these results points out that 2022 was a low baseline for two reasons. First, it was the first assessment conducted after the COVID-19 pandemic, when education systems everywhere were still dealing with the disruption. Second, Georgia had switched from paper-based to computer-based testing, and the decline between 2018 and 2022 is partly attributed to this change of mode.
These points are worth understanding precisely. Georgia moved to computer-based testing in 2018. Because there was no parallel linking study administering both paper and computer versions at the same time to check comparability, the scaling relied on 2015 data as the anchor. That introduces genuine uncertainty into the 2018 and 2022 trend. But it would be wrong to simply attribute the drop to computers – we cannot cleanly say students did worse in 2018 just because the test moved to a screen. The mode change is a complication in the trend, not a proven cause of the decline.
As for the pandemic: yes, 2022 was a COVID-affected cycle. But COVID affected the entire world, not just Georgia. It is not a Georgia-specific excuse, and every country’s 2022 results carry the same asterisk. So while comparing 2025 to 2022 does partly capture a recovery from pandemic losses rather than pure underlying progress, that caveat applies everywhere. What does not change, through any of these caveats, is the point we keep returning to: Georgia remains roughly a standard deviation below the reference mean. The baseline debate adjusts the size of the improvement story; it does not change where Georgia actually stands.
The Question Behind the Numbers
So where does this leave us? Improvement is always good. Fewer low-performing students, best-ever scores in science and mathematics, a real recovery from the 2022 low – these are genuinely positive, and I don’t want to take them away.
But the real question is not whether Georgia improved. It is why Georgia improved. Was it a systemic strengthening of teaching and learning that will compound over future cycles? Was it a recovery from an artificially depressed 2022 baseline? Was it a specific, possibly temporary, push to lift the lowest performers? Was it partly an artifact of testing mode and scaling decisions? Until we understand the cause, we cannot know whether this is the beginning of sustained progress or a one-time bounce.
That is the difference between celebrating a number and understanding it. A rising score is an invitation to ask a question, not a conclusion in itself. Georgia’s students did better in 2025, and that is worth being glad about. But if we want that improvement to mean something for the next generation, we have to understand where it came from – and we have to confront the reading foundation that is still, a decade on, the weakest part of the picture.
The numbers went up. Now we need to understand why.
—
Giorgi Tchumburidze
September, 2026